
In a previous post I showed you how to get MetaData and which methods of **MetaDataResponse **could be used to obtain needed information.
Now we are going to create a simple application that will change the aggregation used for Bars Visualization.
You can find the application in the following github repo: gladimdim/posts-zoomdata-sdk
You can continue editing app.js file from previous post: Getting Source MetaData with Zoomdata JavaScript SDK 2.6
Let’s modify and rename our old function initMetaThread to actually initialize client and return it. We do not need a separate MetaThread object as after the initialization of client and running the visualization, it will contain the MetaThread instance.
async function initializeClient() {
  const client = await ZoomdataSDK.createClient({
    credentials: {
      key: 'KVKWiD8kUl',
    },
    application: {
      secure: true,
      host: 'developer.zoomdata.com',
      port: 443,
      path: '/zoomdata-2.6',
    },
  });
  return client;
}
The returned **client **object contains high-level functions that are used to create queries, run visualizations, etc.
Before we can render the Bars Visualization, we have to create the Query object which is used to ask server for data. Once we create the Query object, we can pass it to
client.visualize(......)function which does everything for us. We just have to tell the source name, Query instance, and DOM element where to render and optional properties.
Let’s add to app.js a new function that can do this for us:
const visualize = async () => {
  const client = await initializeClient();
  const query = await client.createQuery(
    { name: 'My IMPALA Source' },
    {
      groups: [
        {
          name: 'state',
          limit: 50,
          sort: {
            dir: 'asc',
            name: 'state',
          },
        },
      ],
      metrics: [
        {
          name: 'planned_sales',
          func: 'sum',
        },
      ],
    },
  );
  const visualization = await client.visualize({
    element: document.getElementById('visContainer'),
    query: query,
    visualization: 'Bars',
    variables: {},
  });
  return visualization;
};
Now we need to understand what is going on in this function.
Line #2 — we use previously create initializeClient function to create instance of SDK Client.
Then on line #3, we call createQuery function that setups a special object used for querying data from server. Think of this object as an abstraction over SQL query. First argument for this function is an object with single property name, which must be exact name of source you want to query. You can find list of all sources on your server system by doing REST call to:
http://localhost:8080/zoomdata/service/sourcesThe second argument is so called ‘query config’ object.
It is made readable by user configuration which is translated into **Query. **In the config, we provided two collections: groups and metrics.
The Groups collection is used to group results at server:
groups: [
  {
    'name': 'state',
    'limit': 50,
    'sort':
      { 'dir': 'asc', 'name': 'state' }
  }
]
Previously, we told our Query that we want to group by state field, limit items in results by 50, and sort results by state field in ascending order.
This query config format is very readable and you can modify it according to your existing fields in source. To do this, you can call GET REST call:
http://localhost:8080/zoomdata/service/sources/<source_id>This prints all the information about a specific source. There you can find the** objectFields** collection. For this tutorial you can pick any field name which has the type ATTRIBUTE and use it instead of** state. **Remember to modify name used in sort object as well.
Since we provided group collection, Query knows how to group results. But for the Bars visualization we also require it to provide height of each bar. For this we will use metrics collection:
metrics: [
  {
    name: "planned_sales",
    func: "sum"
  }
]
In the sample, above we told our Query object that for numeric values (heights of each bar) we would use field planned_sales with function sum. To adjust metrics collection to your needs, you have to refer to objectFields from:
http://localhost:8080/zoomdata/service/sources/<source_id>and pick any field of type NUMBER.
On line #24, we use the created Query object and pass it to client.visualize method.
client.visualize loads visualization source code, executes it, sets up all threads in web socket (used for meta data and data), instantiate Visualization object and connect it to web socket listeners.Once this is complete, it renders the Bars visualization in the provided DOM element. In our example, it will render in the #visContainer element.
Update your index.html to include jQuery library (used by Bars visualization).
<html>
    <head>
        <title>Zoomdata Meta Service</title>
        <!-- Needed to run built-in visualizations -->
        <script src="./libs/jquery.min.js"></script>
        <script src="http://developer.zoomdata.com/zoomdata-2.6/sdk/zoomdata-client.js"></script>
        <script src="./app.js"></script>
    </head>
</head>
<body>
    <div id="app">
        <div id="visContainer" style="width: 100%; height: 400px"></div>
        <div id="controls"></div>
    </div>
</body>
</html>
Reload the page. You can check if the web socket connection was opened and what
messages were sent. Once server sends us the responses, you can see that the
Bars visualization is rendered:
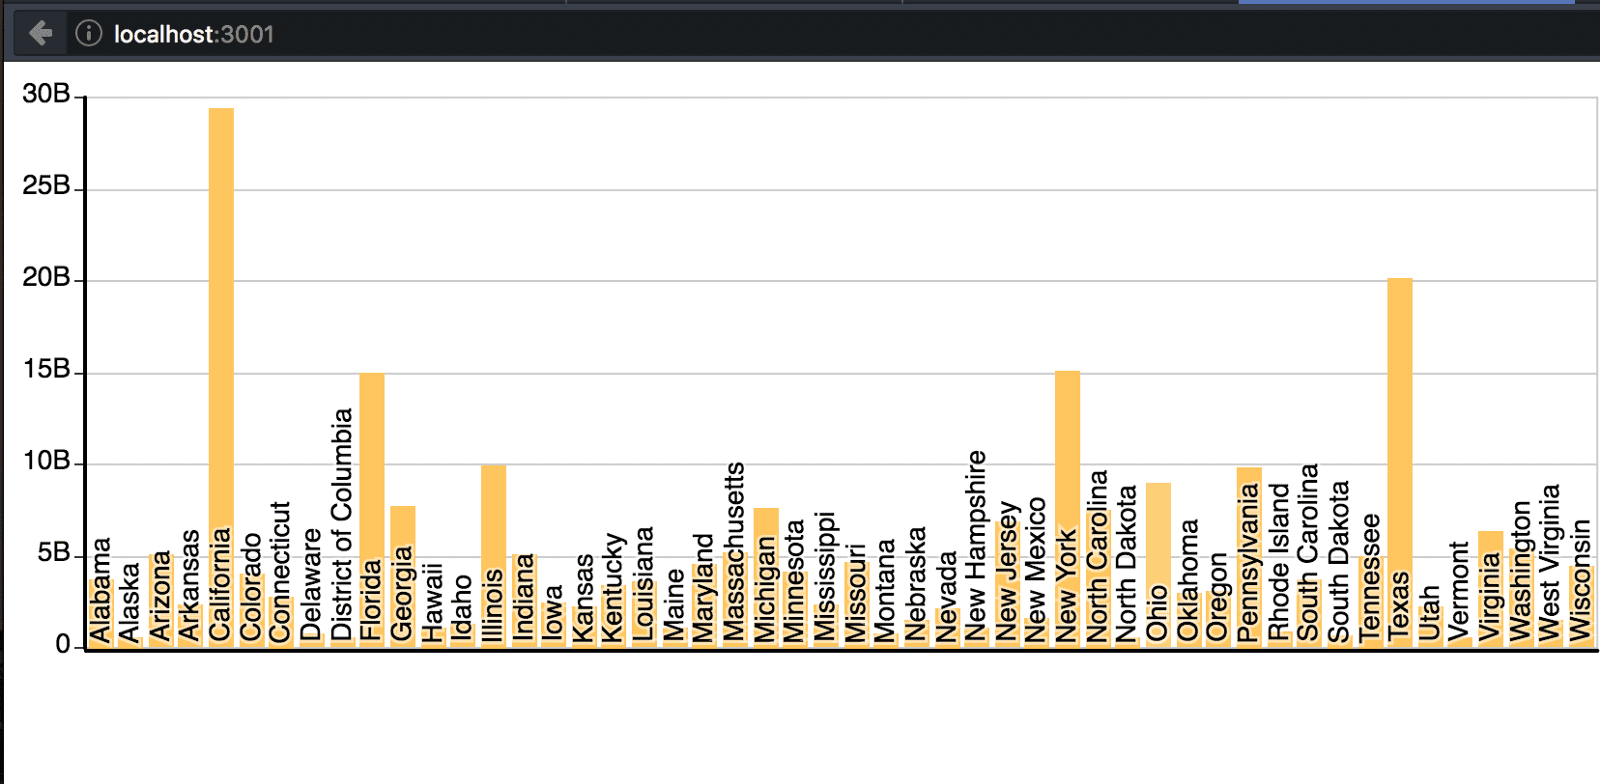
We created the visualization but now we need to add interactivity: add the controls for groups, metrics, etc.
Let’s use the visualization instance to access the MetaData and modify the Query bound to running visualization. When we modify the Query it sends messages to server with new query info and gets responses. The visualization automatically reloads once the data is sent by the server back to the client.
We add the new function **initApp **which prepares the HTML5 Selection Box and reacts to user actions.
const initApp = async () => {
  const visualization = await visualize();
  visualization.query.validationErrors.subscribeOnNext(err => {
    console.log(err);
  });
  const rootDom = document.getElementById('controls');
  const metaData = visualization.metaThread.getLatestResponse();
  const aggrs = metaData.getAttrAggregations().filter(aggr => {
    return aggr.getType() === 'TERMS';
  });
  const aggrsNames = aggrs.map(aggr => {
    return aggr.getName();
  });
  const control = createControl(aggrsNames);

  control.addEventListener('change', e => {
    console.log(e.target.value);
    const firstAggregation = visualization.query.getAggregations(0);

    firstAggregation[0].field.name = e.target.value;
    visualization.query.setAggregation(0, 0, firstAggregation[0]);
  });
  rootDom.appendChild(control);
};On line #2, we get instance of Visualization. It is used to access the Query, MetaThread APIs.
On line #3, we subscribe to Query Validation errors, just in case ;)
On line #14, we create HTML5 Selection element. It show the options where users can select various fields for aggregation.
On line #16, we add event listener that updates the Query with each selection the user makes. Line #21 starts process of updating Query’s first aggregation at first dimension. That is all you need. Visualization updates automatically!
This is the code for createControl function. We just iterate over a list of available aggregation names and create options inside selection HTML element.
const createControl = aggrNames => {
  const rootElement = document.createElement('select');
  rootElement.setAttribute('name', 'aggregations');
  for (let name of aggrNames) {
    const optionElement = document.createElement('option');
    optionElement.textContent = name;
    rootElement.appendChild(optionElement);
  }
  return rootElement;
};
This is the full listing of app.js file:
async function initializeClient() {
  const client = await ZoomdataSDK.createClient({
    credentials: {
      key: 'KVKWiD8kUl',
    },
    application: {
      secure: true,
      host: 'developer.zoomdata.com',
      port: 443,
      path: '/zoomdata-2.6',
    },
  });
  return client;
}

const visualize = async () => {
  const client = await initializeClient();
  const query = await client.createQuery(
    { name: 'My IMPALA Source' },
    {
      groups: [
        {
          name: 'state',
          limit: 50,
          sort: {
            dir: 'asc',
            name: 'state',
          },
        },
      ],
      metrics: [
        {
          name: 'planned_sales',
          func: 'sum',
        },
      ],
    },
  );
  const visualization = await client.visualize({
    element: document.getElementById('visContainer'),
    query: query,
    visualization: 'Bars',
    variables: {},
  });
  return visualization;
};

const initApp = async () => {
  const visualization = await visualize();
  visualization.query.validationErrors.subscribeOnNext(err => {
    console.log(err);
  });
  const rootDom = document.getElementById('controls');
  const metaData = visualization.metaThread.getLatestResponse();
  const aggrs = metaData.getAttrAggregations().filter(aggr => {
    return aggr.getType() === 'TERMS';
  });
  const aggrsNames = aggrs.map(aggr => {
    return aggr.getName();
  });
  const control = createControl(aggrsNames);

  control.addEventListener('change', e => {
    console.log(e.target.value);
    const firstAggregation = visualization.query.getAggregations(0);

    firstAggregation[0].field.name = e.target.value;
    visualization.query.setAggregation(0, 0, firstAggregation[0]);
  });
  rootDom.appendChild(control);
};

const createControl = aggrNames => {
  const rootElement = document.createElement('select');
  rootElement.setAttribute('name', 'aggregations');
  for (let name of aggrNames) {
    const optionElement = document.createElement('option');
    optionElement.textContent = name;
    rootElement.appendChild(optionElement);
  }
  return rootElement;
};

initApp();
Now open the page and select different fields in the selection box:
In next posts, we will create Web Component to embed our visualization and controls into any HTML markup. Also we will add more interactivity — tooltips on hover and data loading indication. Stay tuned.


