Turn Data Into Powerful, Insight-driven Experiences with Logi Analytics
Build lightning-fast embedded analytics experiences while accelerating time-to-value – without requiring additional engineering resources.
Logi Analytics is now part of insightsoftware, – a leading provider of reporting, analytics and enterprise performance management software. Read the press release.
Are Your Analytics Basic, Clunky, and a
Drain on Your Resources?
Disjointed User Experience
A lack of customization and functionality prevents your users from being able to see their data how they want to. Few dashboards are expected to serve the needs of many and the reporting doesn’t stand up to your dashboards.
Roadmap
Disruption
Developer teams are expected to source and build features on a tight timeline. Keeping up with user demand for analytical functionality eats up time and money, taking resources away from core app features and amassing technical debt that stalls the product roadmap.
Painful
Connectivity
Disparate data sources hinder connectivity and components built on a security framework that requires duplication across different layers increases vulnerabilities and reduces control over user access.
Go Beyond Colors and Styles
Get unmatched customization to exceed the most specific or stringent analytics and reporting requirements. Seamlessly integrate and extend functionality without clunky iFrames.
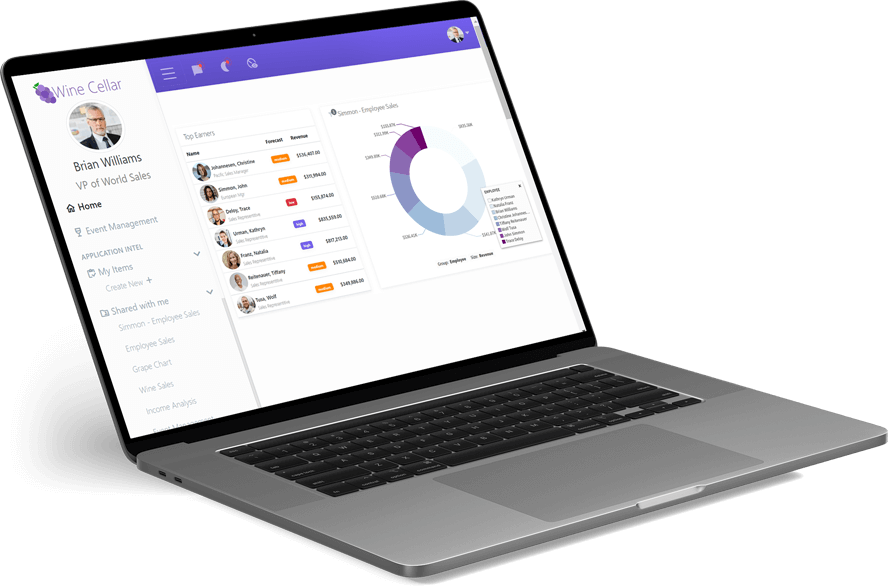
Provide Self- service As Unique As Your Users
Every user is different. Tailor analytics features to their specific skill levels or roles. Inspire your users to generate their own actionable insights.
Leverage Your Current Data and Server Infrastructure
Avoid heavy data modelling and duplicate costs by connecting directly to data sources and your existing hardware. Explore massive data sets with out-of-the-box connectivity.
Avoid Redundant Security Measures
Provide frictionless authentication that aligns with your current security model and maintain precise control over end-user access and governance.
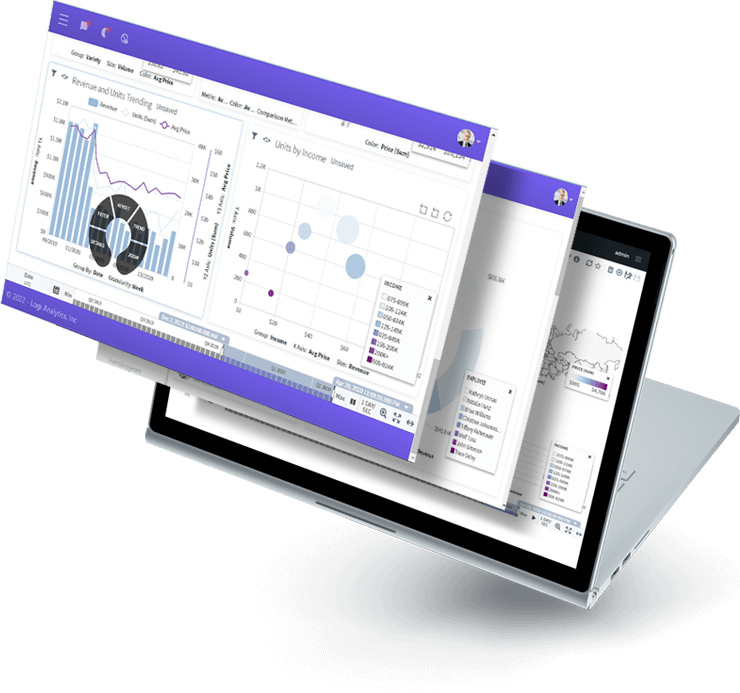
Logi Composer
Completely Customizable, Low-code Dashboard and Data Visualization Platform
Logi Composer allows you to easily build and customize analytics by transforming data from the sources you already have into visualizations that seamlessly embed into your app.
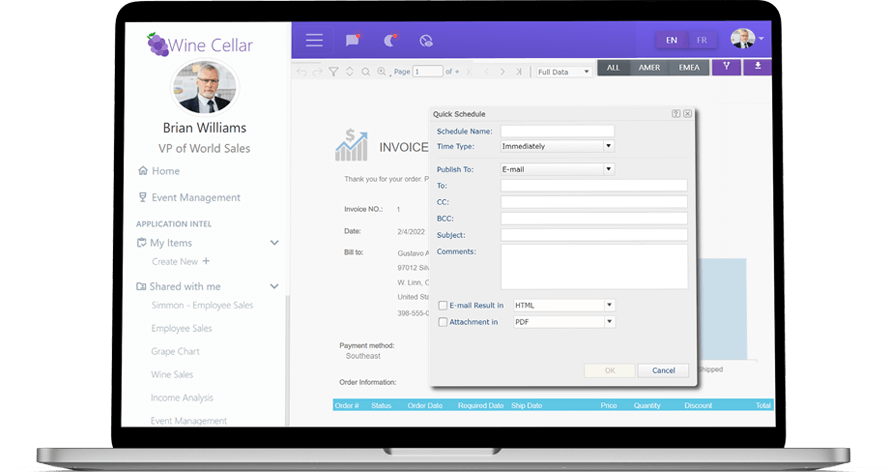
Logi Report
Pixel-perfect Reporting for Data Analysis and Insight
Logi Report enables you to generate and distribute precise reports at scale without coding or leaving the app.
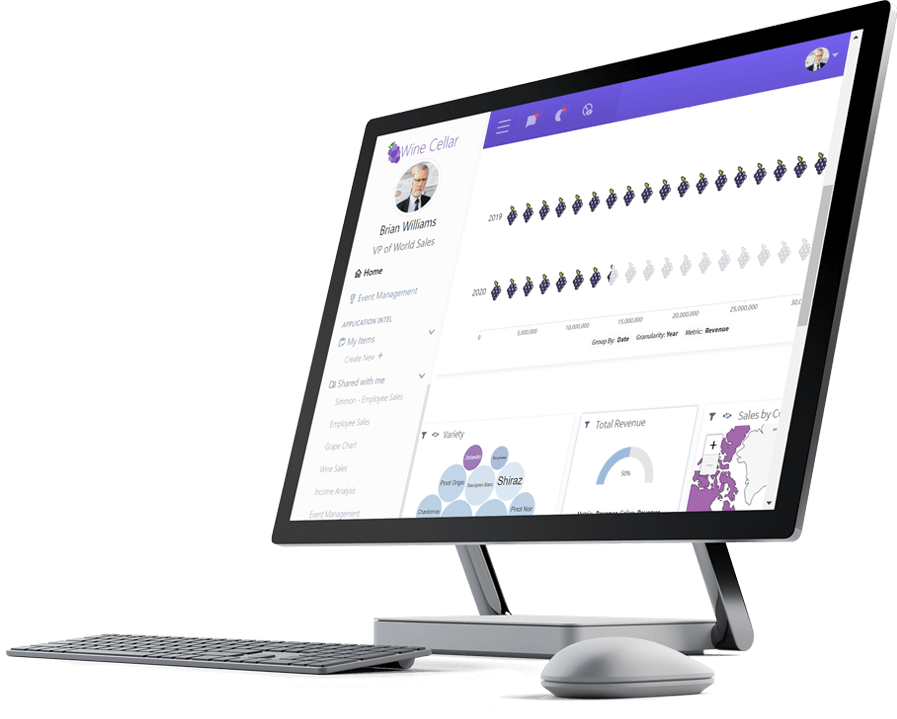
Logi Info
A Robust SaaS Analytics Application for Endless Possibilities
Logi Info is a full data analytics platform that gives you the freedom to build your own BI application your way.
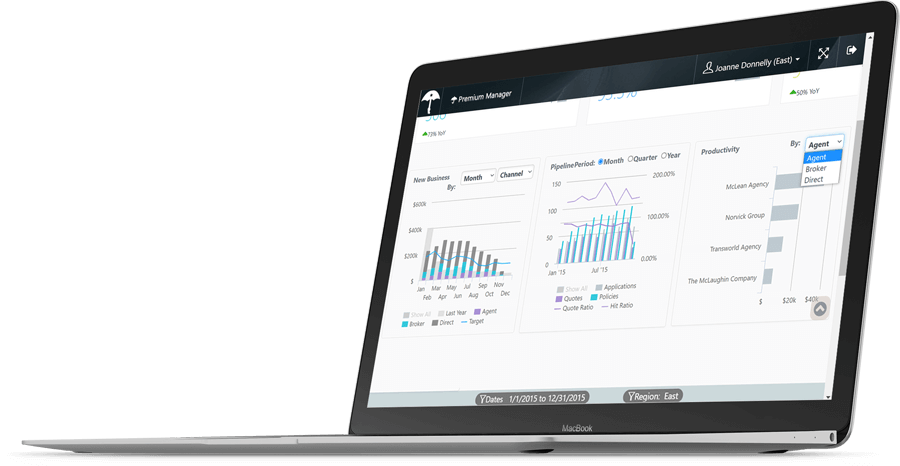
Logi Symphony
A Future-proof Analytics Investment
Logi Symphony gives you access to Logi Info, Logi Composer, and Logi Report so that you never have to compromise your application’s innovation.
Reducing Development Time by 75 Percent with Logi Analytics

The difference is night and day. You couldn't pay me to go back before Logi Symphony.

Speak to an Expert