Custom Chart Tutorial Part One
Welcome to part one of the custom chart tutorial. In this section, you get an introduction to the Custom Chart CLI, how to create a chart with sample code, how to edit the chart’s code, and how to preview the chart.
Let’s dive right in!
Check your development environment
Let’s check first that you have everything set up to start creating custom charts with Zoomdata. You need a recent version of Node.js installed and Zoomdata version 3.7.0 (LTS) or later.
Node.js is a programming tool for running JavaScript on servers and in your computer’s terminal. The Zoomdata Chart CLI is built using Node.js.
Open a terminal window.
See terminal instructions for Mac users and terminal instructions for Windows users.
In your terminal window, type node --version and hit ENTER, then npm --version and hit ENTER.
You should see something like:
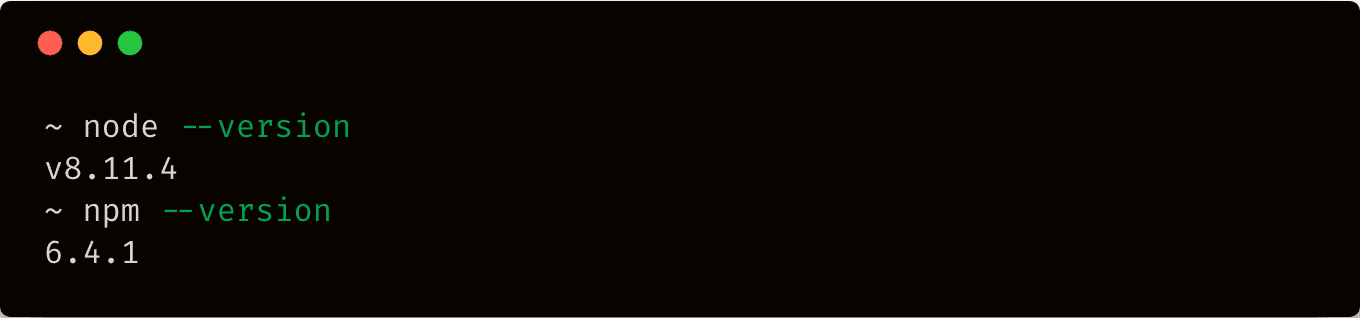
The minimum version of Node.js supported by the Zoomdata Custom Chart CLI is version 6; the minimum version of npm supported is version 3.
If you do not have Node.js installed, go to https://nodejs.org/ and install the recommended version for your operating system.
Install & Configure the Zoomdata Chart CLI
Zoomdata uses the CLI to build, edit, and remove custom charts. To install the CLI, enter the following command in the terminal window.
npm install zoomdata-chart-cli@4 -gOnce that is installed, enter the following command in the terminal window:
zd-chart configThe config command prompts you for the following information:
- Your Zoomdata server URL.
- The username to use for authentication. (typically: admin)
- The password for the username.
Upon entering the information, a prompt asks you if it should store the configuration content in an encrypted file residing in your home directory (~/.config/zoomdata/zd-chart.pref). Enter “y” to finish configuring your environment.
Now let’s check that everything is set up correctly by listing the custom charts available on the configured server: (Note: If this server does not contain any custom charts, the output of the ls command is an empty list)
zd-chart ls
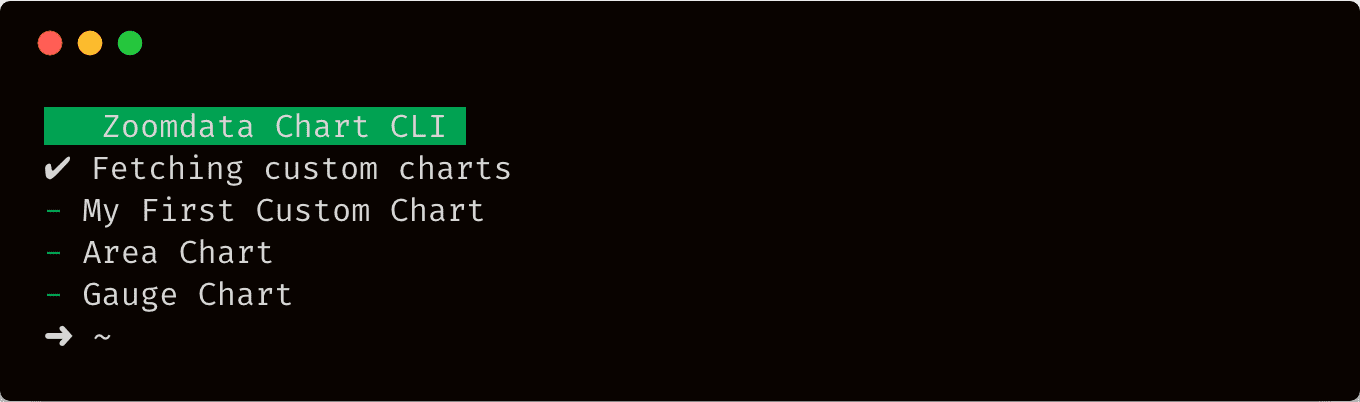
Great! Everything seems to be setup correctly.
Create a Custom Chart with Sample Code
Out-of-the-box, you can specify one of three chart types to get you started:
- Single-Group
- Multi-Group
- Raw
In this tutorial, we will use the default Single-Group template — a chart skeleton with minimal code designed to get you familiar with the basics of the custom chart api.
Enter the following command in the terminal window:
zd-chart init ./my-first-custom-chartThe init command creates a directory in the specified path containing the files you need to get started. Here is a preview of the directory tree:
.
├── package.json
├── src
│   ├── index.css
│   └── index.js
├── visualization.json
└── webpack.config.js
Let’s review the function of each of the files:
package.json: Lists the packages your chart depends on. (More info)visualization.json: Contains the information about the name, controls, & variables of your chart.webpack.config.js: Configuration for webpack. Webpack is used in charts to bundle your code into a single file. (More info)src/index.js: Main entry point to your chart’s JS code. Additional files can be used and imported into index.js.src/index.css: Main entry point to your chart’s CSS code.
From this point, we will need to install the default ”devDependencies” listed in the package.json file.
This step is required before we start working with the chart’s code.
In a terminal window, cd to your chart’s root directory and run the following command:
npm installTo keep a similar naming convention to the out-of-the-box charts, let’s update the chart’s name in “visualization.json” to “My First Custom Chart”.
Edit the Chart’s Code
We are ready to explore the chart’s code. Zoomdata’s charts are comprised of CSS and JS files that make up the chart’s code. The chart CLI lets you update the chart’s code in the server in one of two ways:
- Pushing an updated local copy of the chart back to the server
- Using Watch mode to continuously check for changes to the local component files and automatically update the server’s copy.
Throughout this tutorial, we continuously modify the code and preview the changes. It is best to use Watch mode in this scenario. Let’s start out by compiling a development version of the chart’s code with the webpack bundler. In the terminal window from the root directory of the chart, run:
npm startOn a different terminal window, let’s push the chart for the first time to the configured server:
zd-chart pushFinally, let’s use “watch” mode to continuously update the chart on the server as the code changes.
zd-chart watchThe npm start command instructs webpack to compile the code into a single visualization.js file and continuously watches for changes in the src files to update the chart as necessary.
The zd-chart watch command running in a separate terminal window starts watching for changes in the visualization.json and visualization.js files to push the chart changes back to the server.
We are ready to start modifying the chart’s code. Open the src/index.js file in your preferred text editor or IDE.
Let’s modify the code to output some text on the chart with the total number of records returned by default query.
You will need to modify the controller.update function to contain the code below:
controller.update = data => {
  // Called when new data arrives
  controller.element.innerHTML =
    'The total # of records returned by this query is: ' + data.length;
};
Return to the terminal window where watch mode is enabled, and you should see a message showing that the My First Custom Chart was updated.
Chart Preview
Before we can preview the newly created chart in a Zoomdata dashboard, we need to enable it for a specific source. Navigate to the “Sources” page in Zoomdata by clicking on the gear icon on the navigation bar and selecting Sources. Select one of the data sources where you would like to configure the chart and continue with the following steps:
- Click on the “Charts” tab.
- Click on the “Custom” tab.
- Check the chart named: “My First Custom Chart” to enable it in this source.
- Save the data source.
Let’s take a look at the new chart in a Zoomdata dashboard.
- From the home page, click on the blue New button.
- Select the data source where you enabled the chart.
- Select “My First Custom Chart”.
Your chart should look similar to the following image:
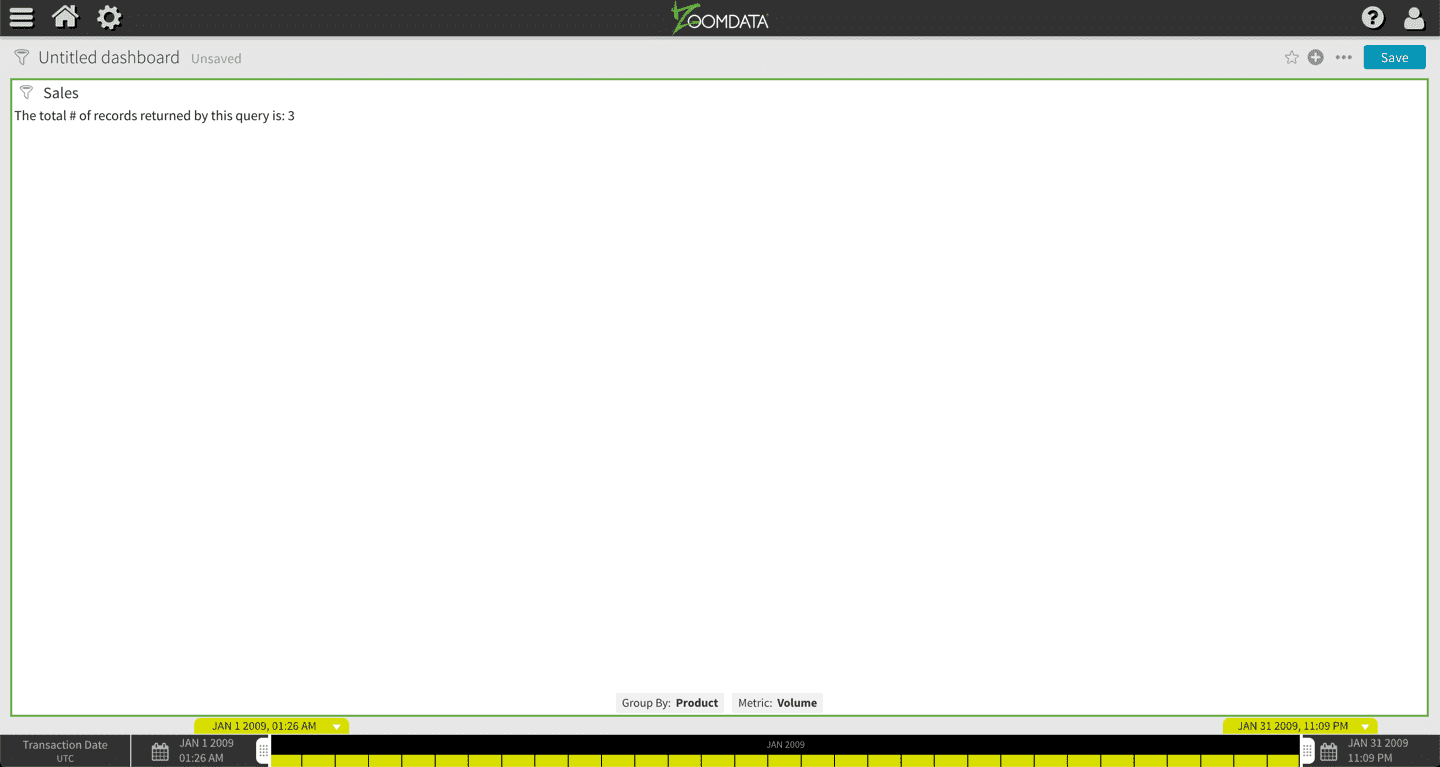
Cool!
You have made it through part one of the custom chart tutorial. So far, you have learned how to install and configure the Zoomdata Chart CLI, how to create a new chart with sample code, and how to update its code and preview the results. Feel free to continue now to the second part of the tutorial or explore the rest of the site.


