Modifying an Embedded Analytics Dashboard
This video shows Jonathan making a change to a dashboard.
Modest changes can make a big difference in the appearance of a chart. Background colors are important. Button and button label styles also contribute a lot to the overall look of a visualization. These can be controlled through the specific class of CSS.
Transcript
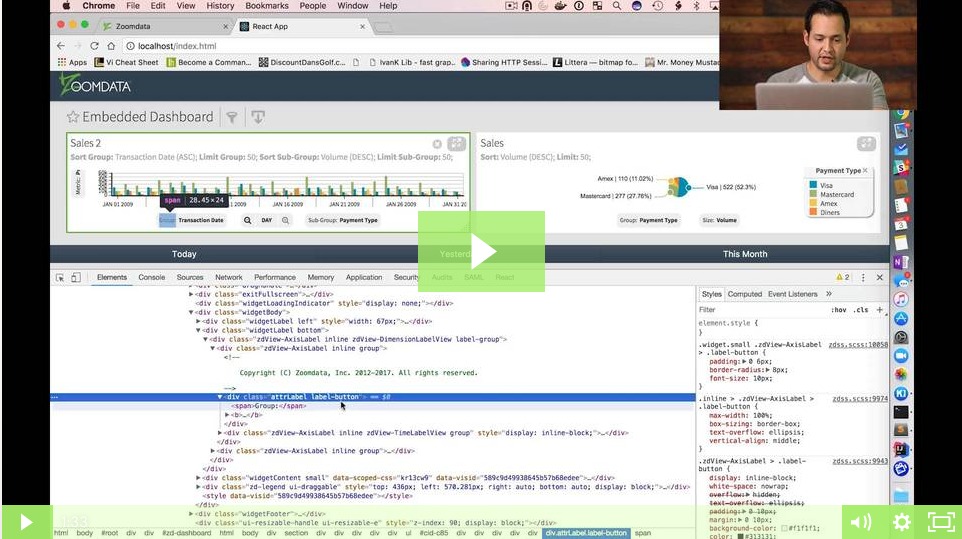
Let me jump back into the dashboard and make one final modification. So, as you can see, we have pickers at the bottom of our charts that allow us to change the group-by and the metrics that we're looking at. I kind of want to make sure that we get rid of this light gray background that we have in this pickers, and I just want to make that white so that it blends nicely with the background.
The HTML Class
So, the first thing that I'm gonna do is I'm gonna find out which is the HTML class that is being used by these buttons. Okay. So, I can see here that we have a class of label button, so I can reuse this class in my CSS, and I'm gonna change the background that way.
A Look at the Code
Let me jump back here into the code, and we're gonna add the label button class, and we're gonna set the background to white, and we set the “important” tag to make sure that we have no conflicts with our CSS. I'm gonna save that. And upon refreshing the dashboard, our button should now have a white background. You can see that on the screen.
